
Antwerp: Growth, Pollution & Rising Unemployment
Antwerp is a vibrant city located in northern Belgium, renowned for its bustling port and rich history in diamond trading. As a major cultural hub, it boasts stunning architecture, world-class museums, and a lively arts scene. The city is also famous for its fashion industry and historic old town. Antwerp combines tradition and modernity, making it a dynamic destination in Europe.
Antwerp Key Statistics Overview
Antwerp Population Statistics
Antwerp has a population of 547,794 in 2024, showing a growth of 4.1% over the past five years, which is slightly behind Leeds' 4.7% growth. The city covers an area of 293 km², resulting in a population density of 1,867 people per km². This density is considered low to moderate and reflects the city's transition toward more suburban areas. Compared to other cities in the same country, Antwerp's density is similar. It is also 53% more spacious than the European average, especially when compared to cities like Barcelona and Turin.
Population Over Time
Chart loading...
Population Density Over Time
Chart loading...
Antwerp Employment & Jobs Data
In 2023, Antwerp had an unemployment rate of 7.6%, which is around the European average. However, the city's unemployment situation is deteriorating faster compared to other cities in the same country, such as Ghent with a 41.1% decrease and Charleroi with a 31.3% decrease. This indicates that Antwerp is facing more challenges in reducing unemployment relative to these cities. The data suggests that job market improvements in Antwerp are lagging behind other urban areas nationally. Overall, Antwerp's unemployment rate remains close to the European average despite the negative trend.
Unemployment Rate Over Time
Chart loading...
Activity Rate Over Time
Chart loading...
Antwerp Tourism & Visitor Statistics
In 2020, Antwerp recorded 725,493 tourism nights, indicating low tourism activity. This figure is significantly lower compared to other cities in the same country, such as Ghent, which had 78.0% more tourism nights, and Charleroi, with 269.4% more. Antwerp's tourism performance is below these domestic counterparts. Compared to the European average, Antwerp's tourism nights also reflect limited visitor engagement. The data suggests Antwerp attracts fewer overnight tourists relative to both national peers and the broader European context.
Tourism Nights Over Time
Chart loading...
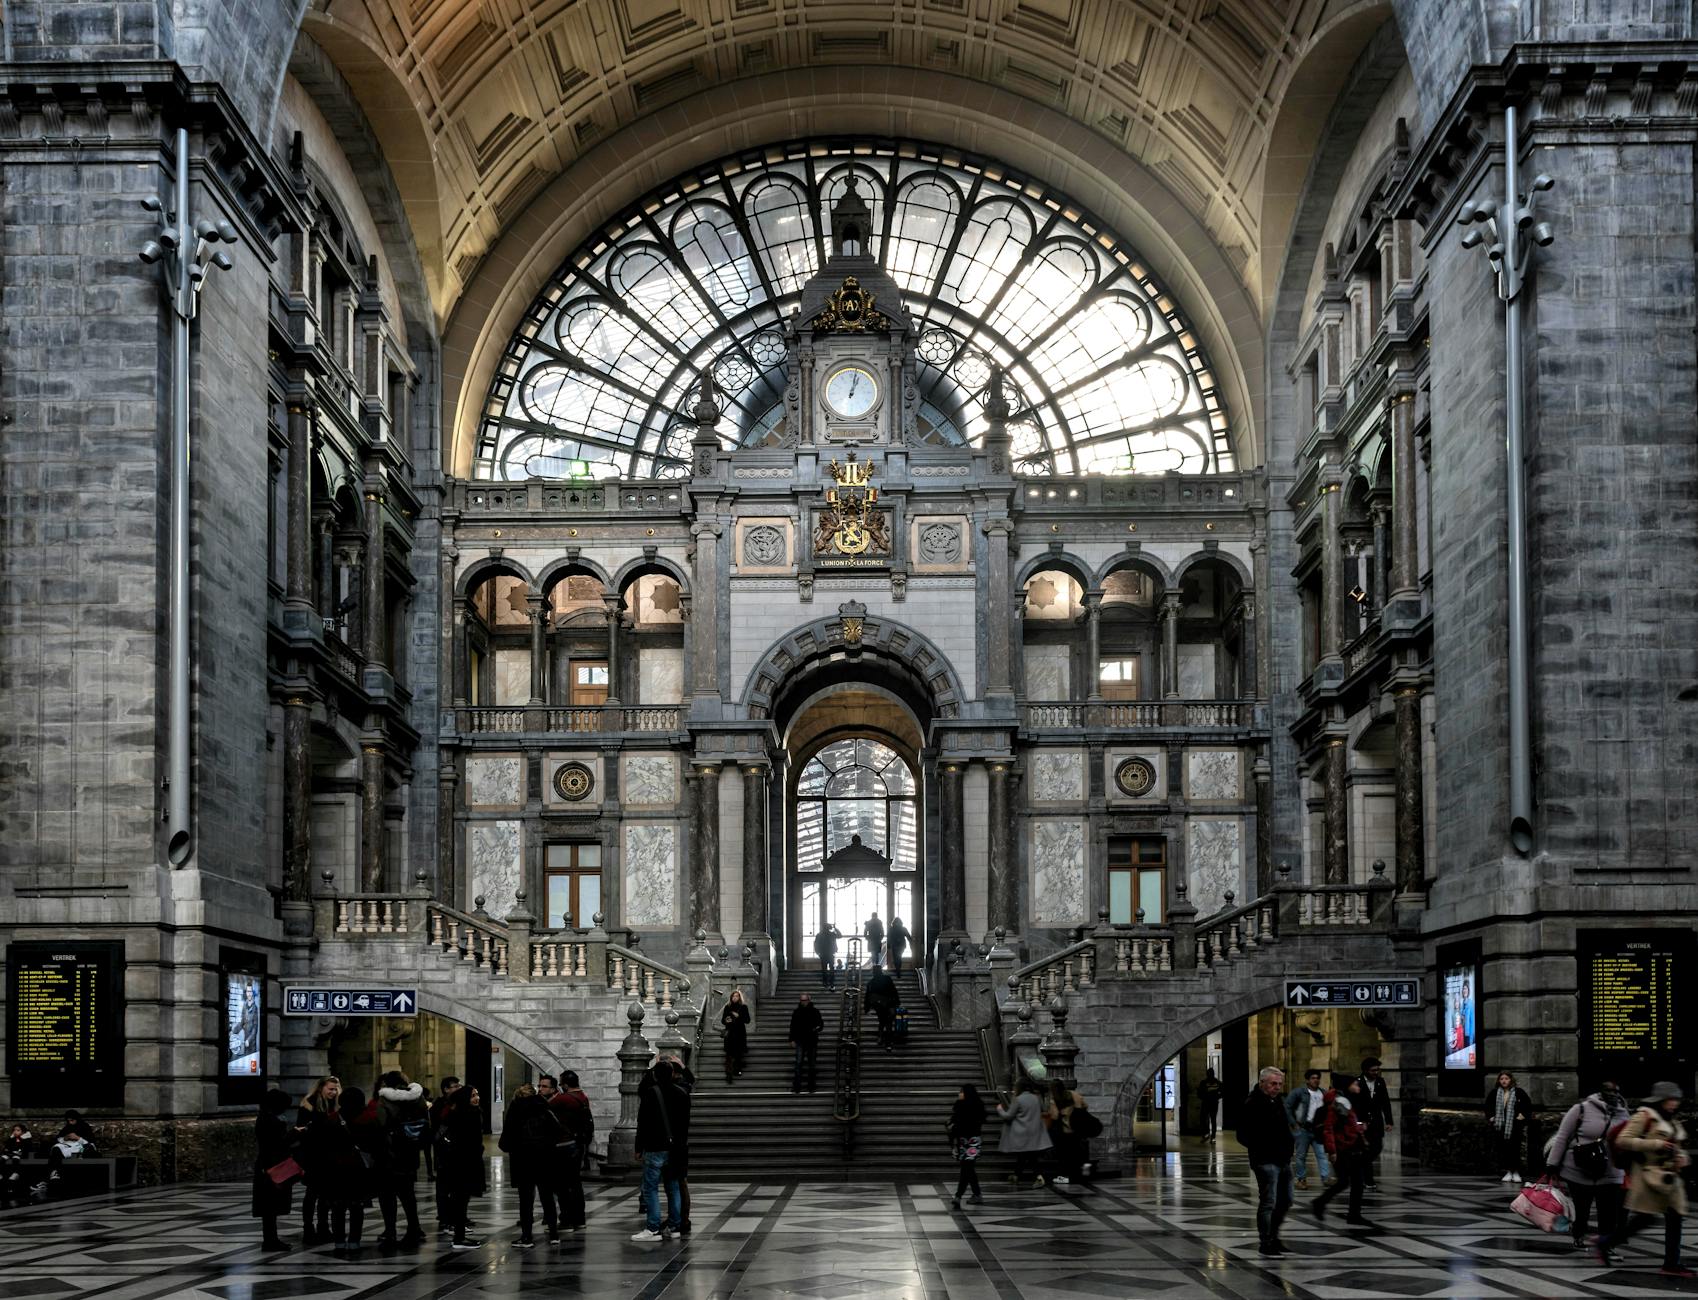
Photo by Wolfgang Weiser on Pexels
Antwerp Environment & Air Quality Data
In 2013, Antwerp had a PM10 concentration of 26.1 µg/m³, which is above the WHO guideline but still within EU limits. This level of air pollution is higher compared to the European average. Antwerp's air quality has been deteriorating faster than other Belgian cities such as Ghent, where PM10 levels decreased by 33.8%, and Charleroi, which saw a 44.4% reduction. The trend indicates a relative decline in air quality in Antwerp compared to these cities.
Air Quality (PM10) Over Time
Chart loading...
Antwerp Statistics Summary
Antwerp stands out as a dynamic city blending rich cultural heritage with modern developments, yet it faces notable challenges. While its population grows steadily and offers a spacious urban environment, the local job market struggles with rising unemployment compared to other Belgian cities. Tourism remains relatively low, limiting the city's visitor engagement despite its attractions. Additionally, environmental concerns persist as air quality declines faster than in neighboring urban areas, highlighting areas for future improvement.