Cologne: Balancing Culture, Jobs & Environment
Cologne is a vibrant city located in western Germany, known for its stunning Gothic cathedral that dominates the skyline. The city is a cultural hub with a rich history, lively arts scene, and renowned museums. Positioned along the Rhine River, Cologne offers a blend of historic charm and modern urban life. It is a popular destination for visitors seeking both architectural beauty and dynamic city experiences.
Cologne Key Statistics Overview
Cologne Population Statistics
Cologne's population in 2024 is 1,024,408, showing a decline of 5.6% over the past five years. This decline contrasts with Marseille, which experienced a population growth of 1.8% during the same period. The city covers an area of 407 km², resulting in a population density of 2,518 people per km². Compared to other German cities, Cologne is 34% more spacious than Hamburg and Berlin. Additionally, Cologne's density is 36% lower than the European average, with cities like Barcelona and Turin having significantly higher population densities.
Population Over Time
Chart loading...
Population Density Over Time
Chart loading...
Cologne Employment & Jobs Data
In 2023, Cologne had an unemployment rate of 4.8%, which is below the European average. The city experienced a greater improvement in unemployment compared to other German cities such as Munich, which saw a 2.6% decrease, and Hamburg, which had a 33.9% decrease. These trends indicate a positive job market development in Cologne relative to these cities. The unemployment rate suggests a relatively stable employment situation in Cologne. Overall, Cologne's job metrics show favorable progress compared to both the European average and other major German cities.
Unemployment Rate Over Time
Chart loading...
Activity Rate Over Time
Chart loading...
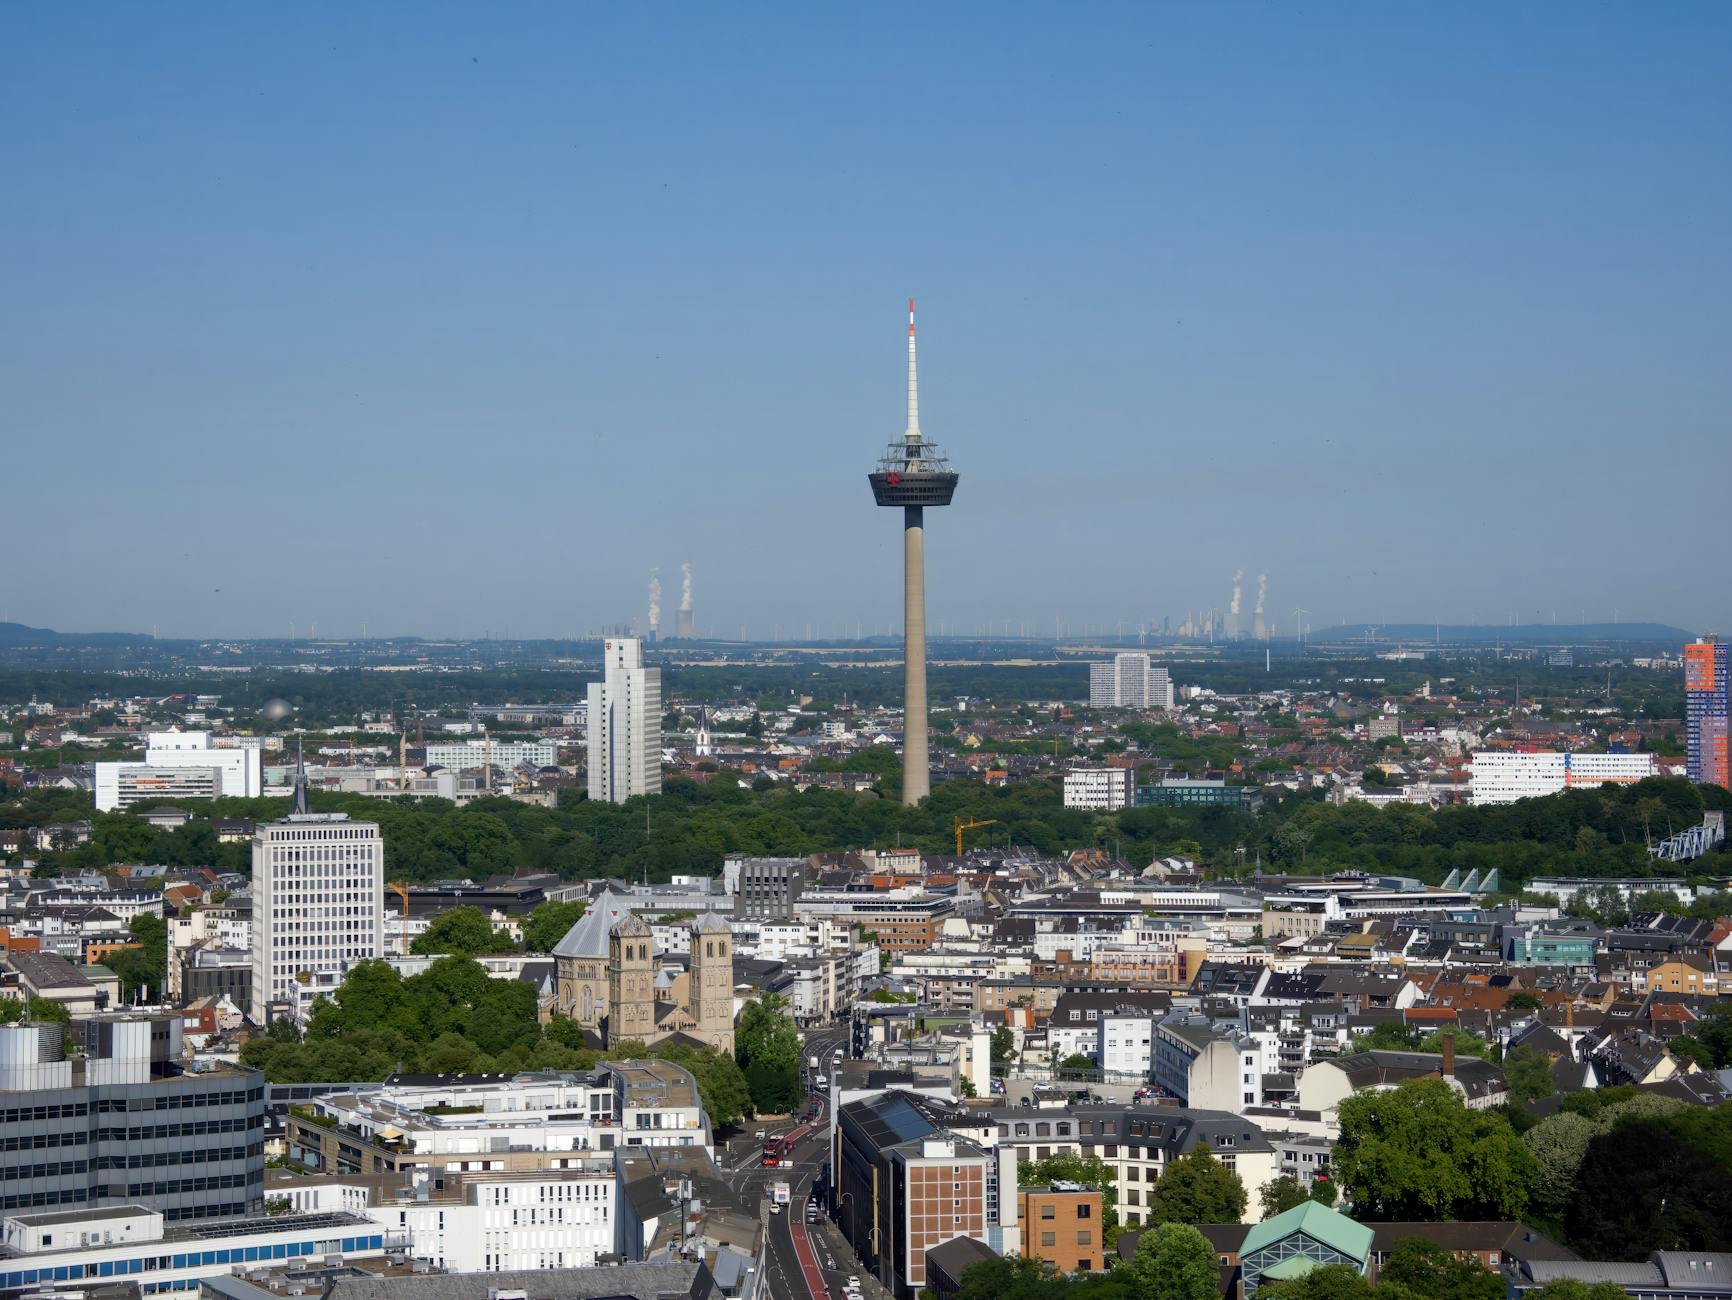
Cologne Tourism & Visitor Statistics

Photo by Aurélien L'Hoost | 🇧🇪 on Pexels
In 2020, Cologne recorded 2,557,212 tourism nights, indicating moderate tourism activity. Compared to other cities in its country, Cologne lags behind Munich, which had 88.5% more tourism nights, and Hamburg, with 156.6% more. Despite this, Cologne remains a notable destination within the national tourism landscape. When compared to the European average, Cologne's tourism nights reflect a moderate level of visitor engagement. These figures highlight Cologne's position relative to both national and continental tourism trends.
Tourism Nights Over Time
Chart loading...
Cologne Environment & Air Quality Data
Cologne's PM10 concentration in 2013 was 21.8 µg/m³, which is within EU limits. However, the city's air quality is deteriorating faster compared to other German cities such as Munich, where PM10 levels decreased by 34.7%, and Hamburg, which saw a 21.5% reduction. Despite remaining within acceptable limits, Cologne's trend indicates a worsening situation. Compared to the European average, Cologne's PM10 concentration is relatively moderate but requires attention due to the negative trend. Monitoring and addressing air pollution remain important for the city's environmental health.
Air Quality (PM10) Over Time
Chart loading...
Cologne Statistics Summary
Cologne stands out as a culturally rich city blending historic landmarks with modern urban living along the Rhine River. While its population has slightly declined, the city offers a spacious environment with a stable job market and unemployment rates below the European average. Tourism activity remains moderate compared to other major German cities, reflecting steady visitor interest. Despite maintaining acceptable air quality levels, Cologne faces growing environmental challenges that call for continued attention to ensure a healthy and vibrant future.